LCA & material health results & interpretation JetSpray™
Scope and summary
- Cradle to gate
- Cradle to gate with options
- Cradle to grave
Application
Spray-on insulation system installed in North America using a blowing wool machine and water pump, used to activate the powdered adhesive. It is sprayed onto exterior and interior cavity walls for thermal and acoustical performance. Insulation is delivered to the installation site as one packaged bag containing varying amounts of product.
Functional unit
Reference service life: 75 years. One square meter of installed insulation material, packaging included, with a thickness that gives an average thermal resistance of RSI=1m2·K/W over a period of 75 years.
Reference flow: 1.02 kg of product with no facing option, at a thickness of 0.0366 m to achieve the functional unit. (ASTM C518)
Manufacturing data
Reporting period: October 2015 – September 2016
Location: Shelbyville, IN and Shasta Lake, CA
Default installation, packaging, and disposal scenarios
At the installation site, insulation products are unpackaged and installed. For loosefill products, an insulation blower is typically used to install the product. No material is lost or wasted because scraps are typically used to fill corners or crevices. Plastic packaging waste is disposed (15% to recycling, 68% to landfill, and 17% to incineration), and no maintenance or replacement is required to achieve the product's life span. After removal, the insulation is assumed to be landfilled.
What’s causing the greatest impacts
All life cycle stages
The manufacturing stage dominates the results for the acidification, global warming, ozone depletion, carcinogens, smog, and fossil fuel depletion impact categories. The remaining impact categories are dominated by the raw materials acquisition stage. Following these two stages, the next highest impacts come from transportation and disposal, which have a similar contribution. However, for ozone depletion, carcinogenics, and non-carcinogenics, the installation and maintenance stage is the third highest contributor due to packaging disposal. The impact of the raw material acquisition stage is mostly due to the borax, manganese oxide, and soda ash in the batch and the dextrose in the binder. Since sand and borax are melted in the oven, they are not released into the air as fine particulates and therefore likely actually contribute less than what is calculated in the results tables below. Quicklime production is associated with global warming impacts due to carbon dioxide emissions from its manufacturing process. The manufacturing stage shows major contributions to all impact categories. The contributions to outbound transportation are caused by the use of trucks and rail transport. The landfilling of the discarded product contributes to the disposal stage. The only impacts associated with installation and maintenance are due to the disposal of packaging waste, which is the smallest contributor of all the stages except for ozone depletion, carcinogenics, and non-carcinogenics.
Manufacturing stage
The energy required to melt the glass and produce the glass fibers is the largest contributor to the manufacturing stage for all impact categories.
Characterized vs. single score results
Due to normalization and weighting, different stages can dominate the characterized and single score results. The batch ingredients sand and borax contribute significantly to the respiratory effects category, causing the raw materials acquisition stage to dominate the mPt results, but not the characterized results. However, they are not released into the air as fine particulates and therefore likely actually contribute less than what is calculated in the raw material acquisition stage. What this means is that the manufacturing stage may have a larger share of the impact than what is displayed in the total impacts by life cycle stage.
Sensitivity analysis
There are no sensitivity results that lead to variations greater than 10% in the LCA results.
How we're making it greener
Knauf is committed to providing products that conserve energy and preserve natural resources.
- JetSpray contains a high degree of recycled content, which translates to 20% less glass melting energy and a 25% reduction in embodied carbon.
- Our utilization of recycled content reduces mining impacts by 60%. In fact, Knauf and Manson products combined use 10 railcars of recycled glass a day.
- A gentle food grade anti-microbial is added to the adhesive system for greener security.
- JetSpray™’s glass is audited by a 3rd party to ensure biosoluble chemistry from a health and safety standpoint.
LCA results
| Life cycle stage | Raw material acquisition | Manufacturing | Transporation | Installation and maintenance | Disposal/reuse/ recycling |
|
Information modules: Included | Excluded* *In the installation and maintenance phase, packaging waste in module A5 is the only contributor to the potential impacts. |
A1 Raw Materials | A3 Manufacturing | A4 Transporation/ Delivery | A5 Construction/ Installation | C1 Deconstruction/ Demolition |
| A2 Transportation | B1 Use | C2 Transporation | |||
| B2 Maintenance | C3 Waste Processing | ||||
| B3 Repair | C4 Disposal | ||||
| B4 Replacement | |||||
| B5 Refurbishment | |||||
| B6 Operational energy use | |||||
| B7 Operational water use | |||||
 |
 |
 |
 |
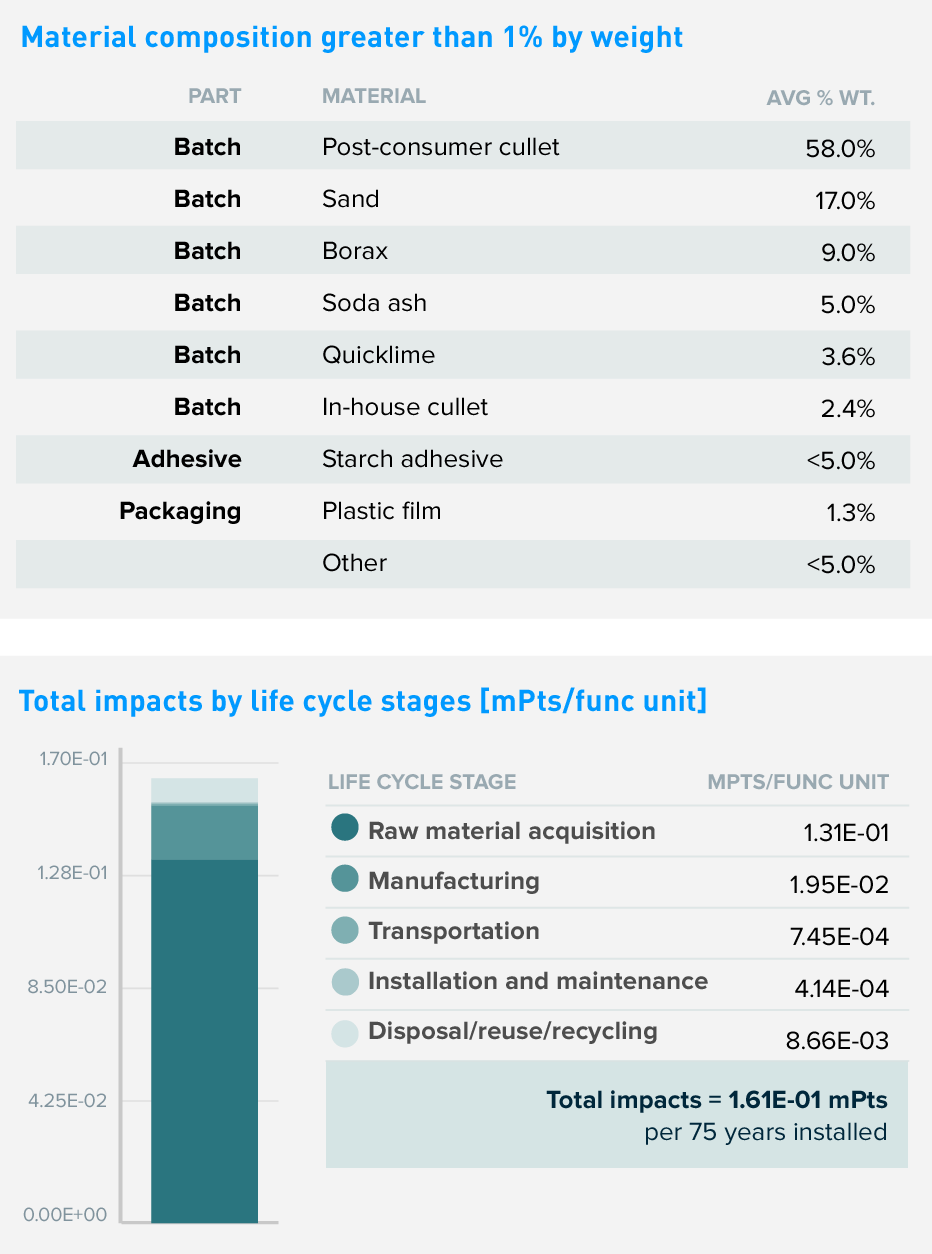
| Impacts per 75 years of service | 1.31E-01 mPts | 1.95E-02 mPts | 7.45E-04 mPts | 4.14E-04 mPts | 8.66E-03 mPts |
| Materials or processes contributing >20% to total impacts in each life cycle stage | Batch material and binder material production. | Energy required to melt the glass and produce the glass fibers. | Truck and rail transportation used to transport product to building site. | Transportation to disposal and disposing of packaging materials. | Transportation to landfill and landfilling of product. |
TRACI v2.1 results per functional unit
| Life cycle stage | Raw material acquisition | Manufacturing | Transportation | Installation and maintenance | Disposal/reuse/ recycling |
Ecological damage
Human health damage
Additional environmental information
| Impact category | Unit | |||||
| Ecotoxicity | CTUe Comparative Toxic Units of Ecotoxicity Ecotoxicity causes negative impacts to ecological receptors and, indirectly, to human receptors through the impacts to the ecosystem. |
8.59E-03 | 2.01E-04 | 5.02E-05 | 1.37E-06 | 1.65E-05 |
| Fossil fuel depletion | MJ, LHV Mega Joule, lower heating value Fossil fuel depletion is the surplus energy to extract minerals and fossil fuels. |
4.03E-01 | 2.20E+00 | 1.90E-01 | 9.18E-03 | 9.38E-02 |
References
LCA Background Report
Knauf Insulation and Manson Insulation Products LCA Background Report (public version), Knauf 2018. GaBi 7, GaBi 2017 database.
PCRs
ISO 21930:2017 serves as the core PCR along with EN 15804 and UL Part A.
ULE PCR Part A: Life Cycle Assessment Calculation Rules and Report Requirements v3.1
May 2, 2018. Technical Advisory Panel members reviewed and provided feedback on content written by UL Environment and USGBC. Past and present members of the Technical Advisory Panel are listed in the PCR.
ULE PCR Part B: Building Envelope Thermal Insulation
Version 2.0, April 2018. PCR review conducted by Thomas Gloria, PhD (chair, t.gloria@industrial-ecology.com); Andre Desjarlais; and Christoph Koffler, PhD.
ULE General Program Instructions v2.1, April 2017
ISO 14025, “Sustainability in buildings and civil engineering works -- Core rules for environmental product declarations of construction products and services”, ISO21930:2017
 Download PDF SM Transparency Report/Material Health Overview, which includes the additional EPD content required by the UL Environment PCR.
SM Transparency Reports (TR) are ISO 14025 Type III environmental declarations (EPD) that enable purchasers and users to compare the potential environmental performance of products on a life cycle basis. They are designed to present information transparently to make the limitations of comparability more understandable. TRs/EPDs of products that conform to the same PCR and include the same life cycle stages, but are made by different manufacturers, may not sufficiently align to support direct comparisons. They therefore, cannot be used as comparative assertions unless the conditions defined in ISO 14025 Section 6.7.2. ‘Requirements for Comparability’ are satisfied. Comparison of the environmental performance of building envelope thermal insulation using EPD information shall be based on the product’s use and impacts at the building level, and therefore EPDs may not be used for comparability purposes when not considering the building energy use phase as instructed under the PCR. Full conformance with the PCR for building envelope thermal insulation allows EPD comparability only when all stages of a life cycle have been considered, when they comply with all referenced standards, use the same sub-category PCR, and use equivalent scenarios with respect to construction works. However, variations and deviations are possible. Example of variations: Different LCA software and background LCI data sets may lead to different results upstream or downstream of the life cycle stages declared.
